Training Page for detection
The training page on Qualviz.ai is designed to help users configure, monitor, and optimize their machine learning models. Below is a detailed guide to its functionalities.
Setting Up Training

Choose Training Options:
- Enter Model Name: Type a name to save and recognize your model easily.
- Training Time: Specify the duration of the training process.
- Options: "Very low", "Low"
- Choose Model Speed: Adjust the speed of the algorithm to balance performance and training time. Select the desired option based on image size:
- Basic → 640
Generate Images for training:
This artificially expands the size of training dataset by creating modified versions of the dataset images.
- Regenerate: Regenerate the preview of all possible augmentations made.
Set to Default: Set augmentation settings to default.
- Epochs: One complete pass through the entire training dataset during the training process.
- Brightness: Defines how much brighter or darker the image can be.
- Contrast: Adjusts contrast strength between two values.
- Saturation: Controls the image’s colorfulness.
- Hue: Shifts colors slightly within a set range.
- Gamma: Brightness adjustment affecting highlights and shadows.
- Gain: Boosts or lowers pixel values for brightness control.
- Exposure: Simulates camera exposure to affect lightness.
Start Training:
- Once all options are configured, click Train to begin the process.
Evaluate the Model
After training, the evaluation section provides insights into the model's performance. The Training Performance Graph helps monitor progress and results.
Training Performance Graph Overview

Key Components:
Graph Axes:
- X-Axis (Training Time/Iterations): Number of iterations completed.
- Y-Axis:
- Left Axis (Loss - Blue Curve): Indicates model’s error.
- Right Axis (Accuracy/IoU - Green Curve): Shows accuracy metric.
Graph Elements:
- Blue Line (Loss): Model’s loss over time.
- Green Line (IoU/Accuracy): Accuracy improvement.
Legend:
- Loss - Misc (Blue)
- IoU - Accuracy (Green)
Data Statistics Panel (Right Panel)
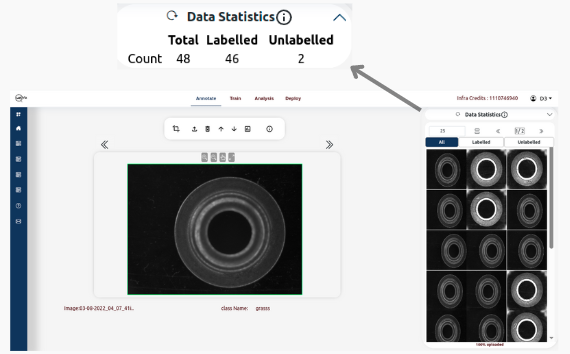
Tabs Available:
- Total: The complete number of images in the current dataset.
- Labelled: Number of images annotated with labels.
- Unlabelled: Images not yet annotated.
Functionalities on the Panel:
- Reset Button: Resets the Data Statistics based on changes.
- Information Icon: Opens tutorial for the data viewer.
Training Details Section
This section provides additional information about the training run:
- Name: srp082
- Quality: Fair
- Status: Completed
- Total Time: 00:03:00
- Actions: Delete, View Training Information
Usage
The training page and its tools can be used to:
- Monitor Training Progress: Check trends in loss and accuracy.
- Identify Overfitting: Spot if accuracy plateaus or loss increases.
- Optimize Hyperparameters: Compare runs to find best configuration.
By using these tools, users can fine-tune models for optimal results.