Analysis Page Documentation for Segmentation
The Analysis Page on Qualviz.ai is designed to evaluate, visualize, and compare model performance. Below are its key features and functionalities.
Model Evaluation Controls (Top Panel)
This panel allows users to control and customize the analysis view. There are two tabs namely, View and Compare.
View section features:

Import Images:
Import additional images to your dataset easily if needed. Supports various image formats like JPG, PNG, etc.Generate Report:
Create a summary of annotations, model performance, and other relevant metrics in a downloadable format.Tutorial On Segmentation:
Learn how to use segmentation tools to accurately mark objects in an image.
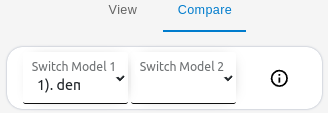
Compare Section Features:
Switch Model 1:
Select or change the first model to compare its segmentation performance, predictions, and metrics.Switch Model 2:
Select or change the second model for side-by-side comparison against Model 1.
This section enables users to visually and statistically compare detection results from different models, supporting better evaluation and informed model selection.
Image Analysis and Controls (Center Section)
The center panel provides tools for visualizing and analyzing segmented images.

- Features:
- Actual Size: Display the image at 100% of its original resolution.
- In/Out: Magnify or reduce the image for precise labeling.
- Pan: Move the image within the viewer.
- Reset zoom: Restore the image to its original position and zoom level.
- Label: The ground truth annotations manually created or imported for training and validation purposes.
- Output: The segmentation result or prediction generated by the trained model on the given image.
- Undo last Annotation: Remove the most recent annotation you made.
Image Information (Bottom Section)
This section provides details about the current image being analyzed.

- Features:
- File Name: Displays the name of the image (e.g., 13_cropped.jpg).
- Component Count: Indicates the number of components detected in the image (e.g., 1 of 1 components).
- Class Name and Color: Shows the segmented class name and its corresponding RGB color (e.g., rgb(243,243,243)).
Data Statistics Panel (Right Section)
This panel provides information and controls for managing the dataset used in the analysis.

Features:
- Total: The complete number of images in the current dataset.
- Labelled: The number of images that have been annotated with labels.
- Unlabelled: The number of images that have not yet been annotated.
Functionalities on the Panel:
- Reset Button: Resets the Data Statistics based upon the changes in all, labeled and unlabeled sets.
- Information Icon: Guides to the tutorial on data viewer.
Key Functionalities:
- Model Performance Evaluation: Compare different quality metrics to assess accuracy.
- Image Inspection Tools: Use zoom, pan, and reset for detailed image analysis.
- Dataset Management: Manage tagged and untagged datasets.
- Multiple Model Comparison: Compare different models and configurations for optimal results.
Use Cases:
- Quality Assurance: Ensure the model meets performance standards before deployment.
- Fine-Tuning: Adjust training configurations based on analysis results.
- Performance Comparison: Compare multiple models to identify the most effective configuration.